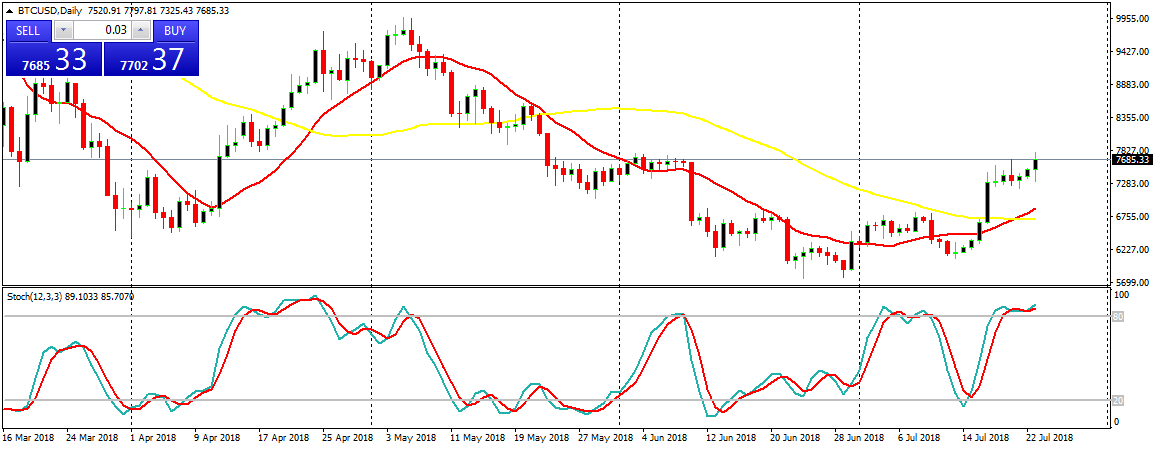
Bitcoin (BTC) Daily Price Forecast – July 23

BTC/USD Medium-term Trend: Bullish
Resistance levels: $7,800, $7,900, $8,000
Support levels: $7,400, $7,300, $7,200
Last week, the price Bitcoin was in a bullish trend and it reached the high of $7,313.14. Thereafter the cryptocurrency went into a sideways movement and later fell to the low of $7,230.93. On Saturday, July 21st, the price of Bitcoin had another bullish movement that took price to the high of $7,407.54.
However, the MACD line and the signal line are above the zero line which indicates a buy signal. Also, the price of Bitcoin is above the 12-day EMA and the 26-day EMA which indicates that the bullish trend is ongoing. The relative strength index period 14 is level 75 which indicates that the market is overbought suggesting bears to take control of the market. Price of Bitcoin will reach the high of $10,000 but will face resistance at the $9,000 price level.
BTC/USD Short-term Trend: Bullish
On the 1-hour chart, the price of Bitcoin is in a bullish trend. On July 23, the price of Bitcoin fell to the low $7,363.29. The MACD line and the signal line are above the zero line which indicates a buy signal. Nevertheless, the price of Bitcoin is above the exponential moving averages which indicate that Bitcoin price is rising.
The views and opinions expressed here do not reflect that of BitcoinExchangeGuide.com and do not constitute financial advice. Always do your own research.
Source: https://bitcoinexchangeguide.com
Share on Facebook Share on Twitter Share on Google+
Please Sign in or Sign Up to post comments